A Beginner’s Guide to Google Analytics

What is Google Analytics?
Google Analytics is a free platform for analyzing traffic on your website. This go-to digital marketing tool features a wealth of useful reports and the ability to segment data to extract valuable insights about your website’s performance.
Why do I need Google Analytics?
Simply put, if you don’t measure something, you have no idea how to improve it. Since your website is often your most important marketing asset, you need to know how it’s performing to reliably optimize it. Google Analytics provides that data for you, so you can increase revenue.
You’ll be able to see data like:
- How many visits your website’s pages receive
- Where those visitors come from (Google Search, copy-and-pasted URL, social media, etc.)
- How website visitors interact with your site
- How long they spend on a page
If you’re noticing low traffic to your site, it’s probably time to optimize your copy for search engines.
If you’re noticing social media traffic vastly outperforming organic, direct, and paid search, consider focusing your efforts on social media marketing.
If you’re seeing high bounce rates on specific pages, you likely need to improve the content. This will better engage visitors and give the people what they’re searching for.
How to set up Google Analytics
Getting started is incredibly simple.
- Go to google.com/analytics.
- Click on the tab to “Start for free.”
- Sign into Gmail.
- Done.
After following these straightforward instructions, you will be provided with a unique code to place on your website. Apply this code to every page on your website. It implements cookies in your visitors’ browsers, which then report back to Google Analytics and log the interactions that visitors had with your site.
These interactions are called “hits” and can be classified as one of three different types:
- Pageview
- Event
- Transactional
Here’s what you need to know about pageview, event, and transactional hits:
Pageview hits
These occur when a user visits any page on your site. Pageview hits tell you information about users, such as the channel they came from, the device they’re browsing with, how long they stayed on a specific page, and where they went to next (or if they exited your site entirely).
Event hits
These occur when a visitor takes action on your site, such as a form submission or link click. This means event hits are measured anytime someone signs up for a webinar, downloads a gated content offer, or clicks a link that bounces from one of your pages to another.
Transactional hits
These encompass ecommerce events, so anytime a user makes a purchase. These hits provide insight about individual product performances, sales performance, the time it takes a user to make a purchase, and more.
Keep in mind: You need to wait 24 hours before the analytics code starts aggregating data. However, once the 24-hour period passes, you’ll have the ability to analyze all that sweet data.
How does Google Analytics work?
Organization of your data is key. After Google gives you the code, you must activate to be introduced to three levels within Google Analytics:
- Analytics Account
- Properties & Apps
- Views
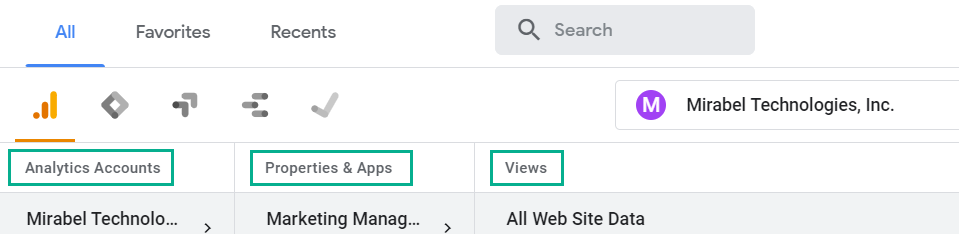
You can access all three categories within the upper left-hand corner of the screen, next to “All Web Site Data” with a drop-down arrow.
If you need help finding your way, use this screenshot as a digital map:

When you click on the arrow, you’ll see “Analytics Accounts.” This refers to the specific email tied to your Google login.
“Properties & Apps” refers to your website domain(s), where you may have multiple disparate sites.
Lastly, “Views” is an area where data can be filtered in different ways. Your first “view” should be labeled as “All Web Site Data.”
Warning: You don’t want to mess with this. Here’s why…
Once you put in filters and delete the original setting in “View,” it cannot be reverted back. That means you won’t be able to recover any of this data.
Instead, when you are in the “Views” section, I recommend setting up filters to create specific target views that interest you.
For first-time Google Analytics users, play around with the options. As data is collected, these filters help you see which analytics are best at helping you drive decision-making processes in marketing and sales.
For example, you may want to target a specific geographic area of interest or even exclude your own company’s IP addresses (to avoid duplicate or skewed data).
What can you learn from Google Analytics?
A lot! GA, for short, equips you with so many options for viewing data across different browsers, devices, user experiences, and more.
As previously mentioned, you will have the ability to view:
- Device
- Location
- Traffic sources
- Content
- Demographics
- And much more
Plus, you can view “Realtime” data to see how many people are on your website in, well, real time.
That means you can see who’s on your website as they’re on your website.
You can also play around with multiple variables, called dimensions, to view specifics like the “quantitative measurement” of men in Romania under the age of 50 who viewed your website at noon on a Thursday via their Android phones — if you were so inclined.
In Google Analytics terms, these quantitative measurements (aka numbers) are called “metrics.”

Which metrics should I track?
The answer to this will depend on the primary function of your website, which I’ll discuss more in depth in a minute. For now, some basic metrics that marketers in any industry should monitor include:
- Bounce rate
- Exit pages
- Goal completion
These web metrics are logical places to start if you are looking to make improvements. They indicate where you are struggling to convert your website visitors.
Bounce rate
Bounce rate shows the percentage of users who leave your website after viewing only one page.
To find the bounce rates for all your site’s pages, click on the Behavior > Site Content > Landing Pages report.
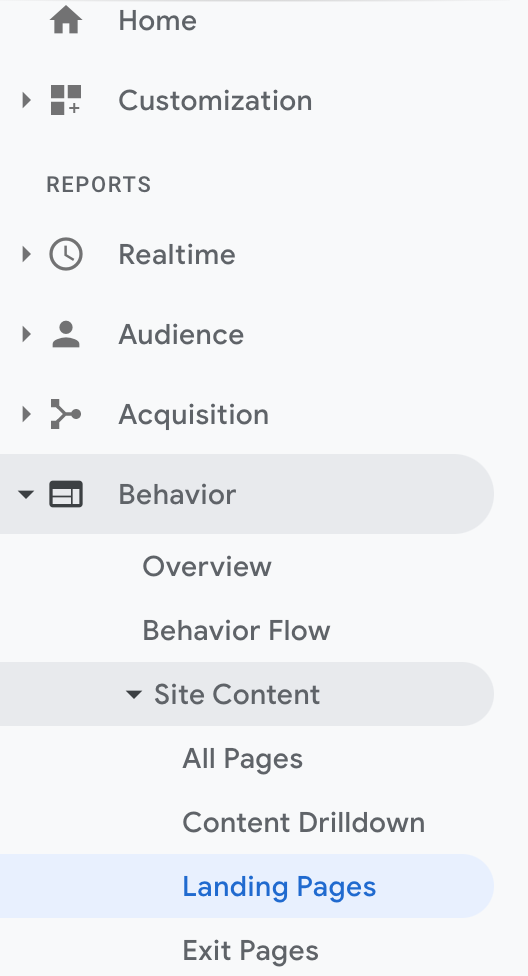
A high bounce rate indicates that unfortunately, your website does not meet users’ expectations or provide the solution they were searching for.
Exit page
This is actually a dimension/metric combo. It shows you the page users exited from, as well as the number of exits.
You can find exit page metrics under Behavior > Site Content > Exit Pages.
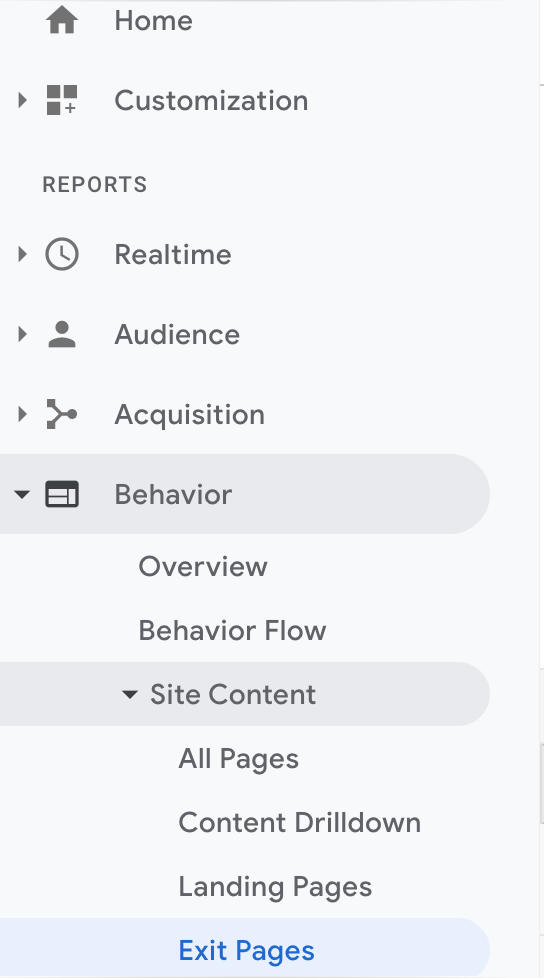
Exit pages often indicate a weakness. If you see a lot of visitors exiting on the same page, it’s safe to assume that the page has problems. Users could be leaving en masse because of these technical issues:
- Lack of mobile friendliness on a specific device like cell phone or tablet, Android or Apple. To determine, use the secondary dimension Device.
- Cultural or language issues for companies with a global reach. To determine, use either Location or Browser Language as the secondary dimension.
- Their search query doesn’t match your content. To determine, use the secondary dimension Keyword.
Goal completion
These metrics are custom fields that you must set up based on what your company’s marketing and sales goals are.
Do you want visitors to fill out a form? Are you trying to decrease cart abandonment? Do you need visitors to sign up for a newsletter?
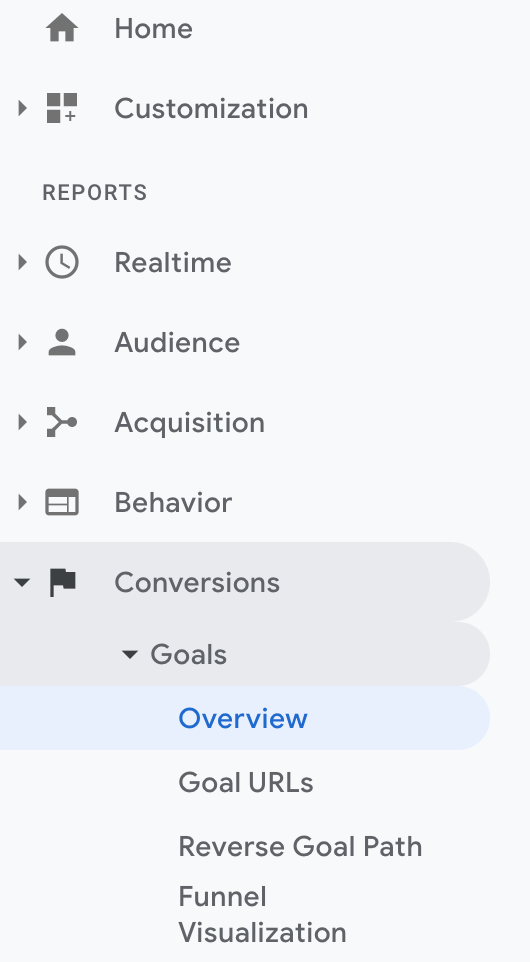
Goal completion will help you quantify and track a specific area of progress.
While every website needs to be an information center, commercial websites especially need to prompt actions that will drive revenue. You need to keep this in mind when setting and reviewing your website goals, because they need to align with your business objectives.
You can track your goal completions under Conversions > Goals > Overview.
Other metrics to track
While several metrics, like the three mentioned above, should be universally tracked, objective-specific metrics need monitoring as well. Websites with the primary function of driving ecommerce sales cannot be evaluated by the metrics used to evaluate a blog-focused website.
Take the average time on page metric, for example. It doesn’t really matter to an ecommerce site how long users are on a page for, as long as the sales transactions keep flowing.
For a blog, however, this metric is a key performance indicator (KPI). It shows whether users are taking the time to read (finding value) or leaving the page quickly (not finding value). If they’re not finding value, the blog needs to be improved.
In addition to determining the KPIs you’ll use to evaluate your website’s success, you have to spend some time getting familiar with the platform. This is to ensure Google Analytics can provide the data you need, because not all reports are built equal.
Luckily, there are many free resources, such as YouTube videos, that tackle the subject. Another free resource is Google’s Analytics Academy. This educational platform will provide you with a deeper understanding of what you can do in GA and how to do it.
Do I need other analytics tools besides Google Analytics?
Absolutely! Google Analytics is a great, comprehensive tool for anyone who has a website. It allows you to view your crowd of visitors and see their overall behavior when aggregated on your site.
Mirabel’s Marketing Manager takes what Google Analytics provides and dives even further. It lets you see the faces in the crowd. Specifically, it’s able to identify the individuals (with contact information) who visit your site, even if they have no previous interactions or form fills.
Mirabel’s Marketing Manager also uses permanent tracking technology, whereas Google Analytics is cookie-based. Visitors tracked via cookies can disappear and reappear on your radar without you ever knowing it was the same person.
Mirabel’s Marketing Manager lets you know individuals by name and provides a permanent digital trail of every single interaction they ever have with your site.
As we learn more about them, we gather a profile, so when they do fill out a form and are added to your CRM, the data is automatically filled out. It cuts prep time for pitches in half and avoids duplicate demographic data.
Because of their unique strengths, we view Google Analytics and Mirabel’s Marketing Manager as complementary. Google Analytics shows how visitors interact with your site, while Mirabel’s Marketing Manager shows you who interacts with your site.
The marketing automation software pulls sales-ready leads from your visitor pool. In doing so, your sales reps are armed with vital info for their first calls or emails.
Conclusion
While getting familiar with comprehensive analytics platforms like Google Analytics and Mirabel’s Marketing Manager requires time and patience, having the data they provide at your fingertips is indispensable in continuing to grow your business.
Nathan Cenovski contributed to this blog.
SEE FOR YOURSELF
Watch an overview to learn how B2B marketing automation by Mirabel Technologies can help you increase traffic, optimize your funnel, drive more leads, improve conversions, and boost ROI — at a price you can afford!
