THE NUMBERS OF EMAIL MARKETING

Table of Contents
When it comes to tracking the success of your email marketing campaigns, monitoring analytics is integral.
But…
To know whether you’re really on track, you need benchmarks to compare your data to.
If your campaigns typically result in a 15% open rate, that’s good. It’s consistent.
But…
When compared to the industry average open rate, 15% could be on the low end. That signals room for improvement somewhere in your email campaign.
So, by industry standards:
- What is a good open rate for email marketing campaigns?
- When is the best time to send a marketing email?
- How long should a marketing email be?
We’ll answer all that and more, as we break down the benchmarks you need to know to stay on track and maximize your email marketing efforts.
Engagement Analytics
Tracking these data points is essential to email marketing success. Engagement analytics let you know what works in your strategy and what could use some improvement.
Let’s take a look at industry benchmarks for each, so you can gauge your performance.
Remember: We took a look at various company data. These email marketing trends change almost annually, so be sure to stay up-to-date on your industry.
Open Rate
This metric refers to the percentage of subscribers who opened your email.
In general, this should be around 21%. Depending on your industry, this number can be as high as 28% (government, nonprofits) or as low as 15% (retail).
Your open rate is a direct reflection of your subject line. However, other factors include:
- Send time
- Day
- Frequency
(We’ll get into some tips for successful subject lines in just a bit.)
Click-through Rate
This is the ratio of individuals who clicked on a link in your email out of those who opened it.
The average click-through rate, based on data from MailChimp, is 2.62%. Like open rates, this metric varies per industry.
For example, government emails have an average click-through rate of 6%, but retail emails have an average click-through rate of just over 1%.
The factors impacting your open rate can also impact your click-through rate. If email subscribers aren’t opening, they sure aren’t clicking.
But, you should also consider your email’s body content.
If your email receives solid open rates but has low click-through rates, it’s likely that the body content could use some adjusting. Maybe feature more links throughout or make your call to action more exciting, all to better facilitate clicks.
(We’ll get into some tips for that in just a moment, too.)
Bounce Rate
Just because you send an email doesn’t mean it always makes it to an inbox. This email analytic refers to the percentage of sent emails that couldn’t be delivered.
The average bounce rate is about 2%. While it can be a bit higher depending on your industry, you want this number to be as low as possible. A high bounce rate harms your sender reputation and impacts the success of future email campaigns.
Bounce rates typically incorporate both hard and soft bounces. When an email hard bounces, this means you likely sent to an invalid email address.
To make sure this doesn’t happen again, you should:
- Remove any email addresses that generate hard bounces from your list immediately. This is one of the most surefire methods to see an immediate improvement in bounce rate.
- Require future subscribers to double opt-in. This means subscribers need to confirm their opt-in request via an email sent to the address they entered. This will weed out any fake, misspelled, and inactive addresses.
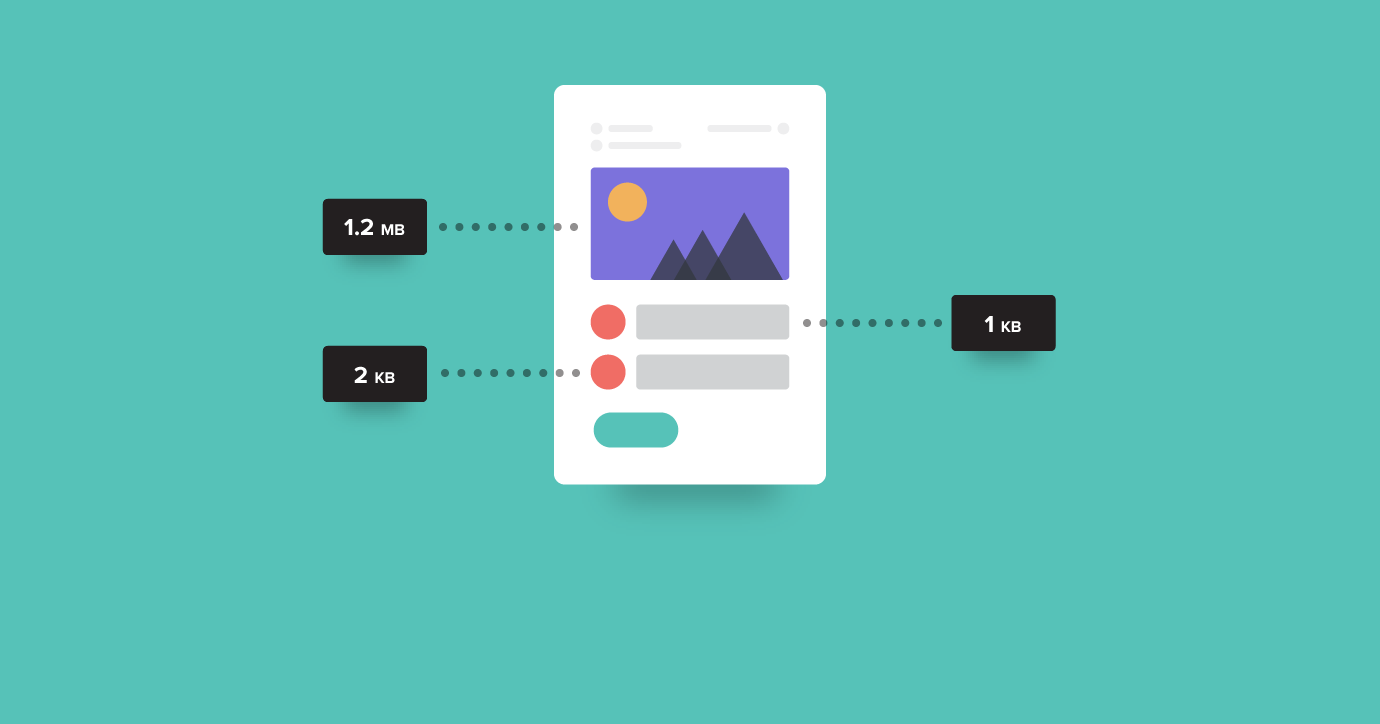
While soft bounces are less dire, they’re much more common. In addition to inbox-related issues, the size of your email and its content can lead to a soft bounce. To prevent this, try:
- Reducing the file sizes of any images to a maximum of 100 KB. It’s not required, but it definitely keeps the overall weight of your email on the lower end. Spam filters tend to get involved when emails exceed a weight of 120 KB.
- Avoiding spammy words (and HubSpot detailed an exhaustive list) in your subject line or body content that could catch the attention of spam filters.
Unsubscribe Rate
This metric refers to the percentage of subscribers who actively unsubscribed in a specific email to no longer receive your campaigns.
The average unsubscribe rate is .5%, and this is standard across all industries. Like bounce rates, the lower the number, the better.
While .5% seems like a very low number, it’s important to remember that unsubscribing is typically a last resort. Most of the time, if someone doesn’t want to read an email, they just won’t open it.
If you’re noticing high unsubscribe rates, your send frequency and/or sender name could be why.
If you don’t send often enough, it’s out of sight, out of mind. Subscribers may no longer care to read your content. Even worse, they forget entirely that they opted in to your campaigns.
If you send too often, subscribers will get annoyed to a point where ignoring isn’t enough.
Many internet-savvy users know a phishing scam or spam email when they see one. Use a recognizable sender name and email address to avoid the trash and a bad sender reputation.
Sending Stats
Admittedly, this is the most subjective benchmark category. It includes recommendations for the best day, time, and frequency to send email campaigns.
The type of content you send and to whom (B2B/professional inboxes vs. B2C/personal inboxes) influences when a campaign should go out. Because of varying factors, no solid across-the-board time and day exist.
No data answers “when is the best time to send a marketing email.”
But…
You can definitely use estimated industry benchmarks as starting points. Be sure to track and tweak your strategy based on the results.
Best Day to Send
The short answer is a weekday.
The more detailed answer is specifically Tuesday through Thursday.
The most detailed, research-backed answer is Tuesday. This is followed by Thursday and then Wednesday.
Generally, inboxes go neglected on Saturdays and Sundays.
Monday inboxes get pretty crowded, usually with unread Friday afternoon and weekend messages. Inbox providers handle an influx of emails from companies that all had the same idea: Schedule campaigns for Monday at 9 a.m. in order to be at the top.
By Friday, most email users are mentally tapped out. No one wants to read anything, much less a little newsletter before the weekend.
Ergo, sending emails in the middle of the week will result in higher engagement metrics. This is because everyone is busy shuffling through their inboxes, deciding what to open, click, and delete.
Again, it’s best to remember that these benchmarks depend on your audience.
Weekday sends are especially important for B2B companies, because their recipient lists mainly consist of professional email addresses. Most people tend to check their emails less frequently on weekends, but even more so the case of work inboxes.
Now, if you’re a B2C company with an email marketing goal of selling goods, weekends, (particularly Saturdays) are actually recommended. This is mainly because people have the time to spend reading about your fun offer and shopping for products.
Best Time to Send
For B2B companies, it’s recommended that emails be scheduled between 8 and 10 a.m. This is when people first log in for the day. Between 12 and 2 p.m. is also recommended, as this is when people take and return from lunch breaks.
You’ll likely see higher engagement rates from sending at these times because your recipients’ focus isn’t compromised by work tasks yet; they’re checking their emails to ease themselves into, or back into, the day.
For B2C companies, the recommended best time to send emails is between 6 and 9 p.m. Many people tend to check their personal emails during the commute home, after dinner, and/or before bed.
Some people use online shopping to decompress from the day, and many decide where to shop based on whatever deals are in their inbox.
Best Frequency to Send
Research by Zettasphere shows that the frequency sweet spot is 6.21 emails per week.
Since this research was conducted on clothing retailers, six emails per week is a much safer recommendation for B2C companies.
For B2B companies, the answer is less clear. You have to play around with the frequency to determine what works best.
For example, with something like a newsletter, you can get away with sending as frequently as every day. The key to holding on to subscribers is clearly stating what the newsletter’s frequency will be in the sign-up form.
For other marketing content, such as promotions or announcements, optimal send frequency looks more like four to five emails per month, or one per week. With this frequency, you’re regularly keeping in touch with your audience without overwhelming or annoying them to the point of unsubscribing.
If your engagement analytics are improving, test an increased frequency, like twice or three times per week.
Should you choose to begin testing, avoid sending emails on back-to-back days. Choose a Monday/Wednesday/Friday or Tuesday/Thursday schedule.
The final email marketing tip is to always consider your previous campaigns’ engagement metrics.
For example, if Saturday sends previously haven’t been successful for your B2C company, don’t do it because it’s an industry benchmark. Continue with what works for you, and look for other areas for improvement.
Content Counts
Enter: The other areas for improvement.
I touched on them briefly during the engagement metrics portion of this blog. These are the other primary factors impacting your email campaign performance.
Sender Name
It’s one of the first things subscribers see when your emails hit their inboxes: The sender name (or from name).
It’s recommended to keep the sender name under 30 characters, because this is the maximum most inbox providers will show on a desktop browser. Mobile browsers and email apps are more forgiving.
We recommend going even shorter, aiming for 20 characters. For inbox providers, like Gmail (www.google.com/gmail), any longer means cutting off your sender name.
If your desired sender name can’t be condensed to 20 characters, at least ensure your brand can be easily identified within the first 20 characters.
Subject Line
This is another primary thing subscribers see when your emails hit their inboxes. Per CoSchedule, creator of the very handy Email Subject Line Tester tool, subject lines that perform best are usually 3 to 5 words long. They contain between 17 to 24 characters.
If you need a little wiggle room, Mailchimp recommends a maximum of nine words and 60 characters.
As an experiment, our marketing team checked their inboxes via desktop (with Outlook) and mobile (with Apple Mail). The desktop cut subject lines off after 39 characters, while the app cut it off after 53 characters.
Keeping the count under 60 characters is safe, but keeping it under 30, if possible, can really boost those open rates.
As with sender names, start with the most pertinent info. This way, if your subject line does get cut off, you get the most important, attention-grabbing bits out there first. That means you have a better chance at nurturing an open.
Body Content
The purpose of a marketing email is to generate enough interest with the least amount of information possible. Less is more, am I right?
If subscribers are interested, they can get details by clicking on the links you absolutely need to include in the body content.
With that being said, your emails should contain a maximum of 100 words. The real sweet spot, according to MailUp, in terms of generating clicks is 75-100 words, complemented by one to three visual elements.
They also suggest adding a call-to-action button, all of which are hyperlinked to the main offer. The more links, the more opportunity for an above-average click-through rate.
Wrapping Up
So, there you have it: The numbers of email marketing!
Remember in childhood when Mom would hit you with the “Just because everyone else is doing it doesn’t mean you need to?”
Well in this scenario, it’s absolutely OK to want to follow and be average — at least to start.
By having a better understanding of what your open, click-through, bounce, and unsubscribe rates should look like (and knowing which practices work best in creating and sending campaigns), you’ll be better positioned to succeed in your email marketing efforts.
SEE FOR YOURSELF
Watch an overview to learn how B2B marketing automation by Mirabel Technologies can help you increase traffic, optimize your funnel, drive more leads, improve conversions, and boost ROI — at a price you can afford!

