Why Google Analytics is Best for Data-Driven Content Marketing

Most marketers (if not all) will tell you that it’s all about data-driven content marketing strategies.
You find what people are searching on Google to determine your content strategy.
You track website activity for retargeting paid search ads.
When it comes to organic or paid content marketing, it’s about figuring out how to use data to enhance and optimize your digital strategy.
Utilizing this data has never been easier, thanks to the king of search engine analytics: Google Analytics.
Understanding Google Analytics helps you produce content that your target audience wants to see. The platform provides actionable insights, like click-through and bounce rates, time spent on page, and more.
It’s a must-have in every marketer’s toolkit.
This article will explain what is content marketing and how to use available to enhance your Google Analytics marketing strategy.
What is Content Marketing?
Content marketing is like all pieces of writing. It’s used to:
- Educate
- Inform
- Entertain
- Persuade/Sell
Content is defined as anything that you’re sharing with your target audience. It can include:
- Emails
- Print Newsletters or Mailers
- Digital Ads
- Social Media
- Blogs
- Downloadable Content (Guides, white papers, case studies, checklists)
- Infographics
- Videos/Gifs
- Podcasts
- Chatbots
- Landing Pages
- Radio Scripts
(If you’re interested in learning about which content can elevate your strategy, click here to see our top content marketing examples, then take the next step by implementing these content marketing upgrades.)
Content marketing involves all steps of the process:
- Conceptualization
- Strategy (keyword research, competitor analysis, pillar content)
- Production (writing/editing, graphic design, formatting, backlinking)
- Promotion (distribution via email, social media, press release)
Each piece of content is made with one of those goals in mind. Together, all the content nurtures leads through the buying process: Awareness > Consideration > Decision > Brand Advocacy.

Key Metrics to Track Your Content
When it comes to content marketing, it’s best to put together a content strategy.
After all, creating and promoting content is hard work. You don’t want that effort to go to waste with content that people aren’t searching for and won’t read.
A great place to start developing a content strategy is Google Analytics. The free platform features a selection of tools to analyze and track data across your marketing strategy.
Here, we’re going to focus on metrics you can use to track the success of content specifically.
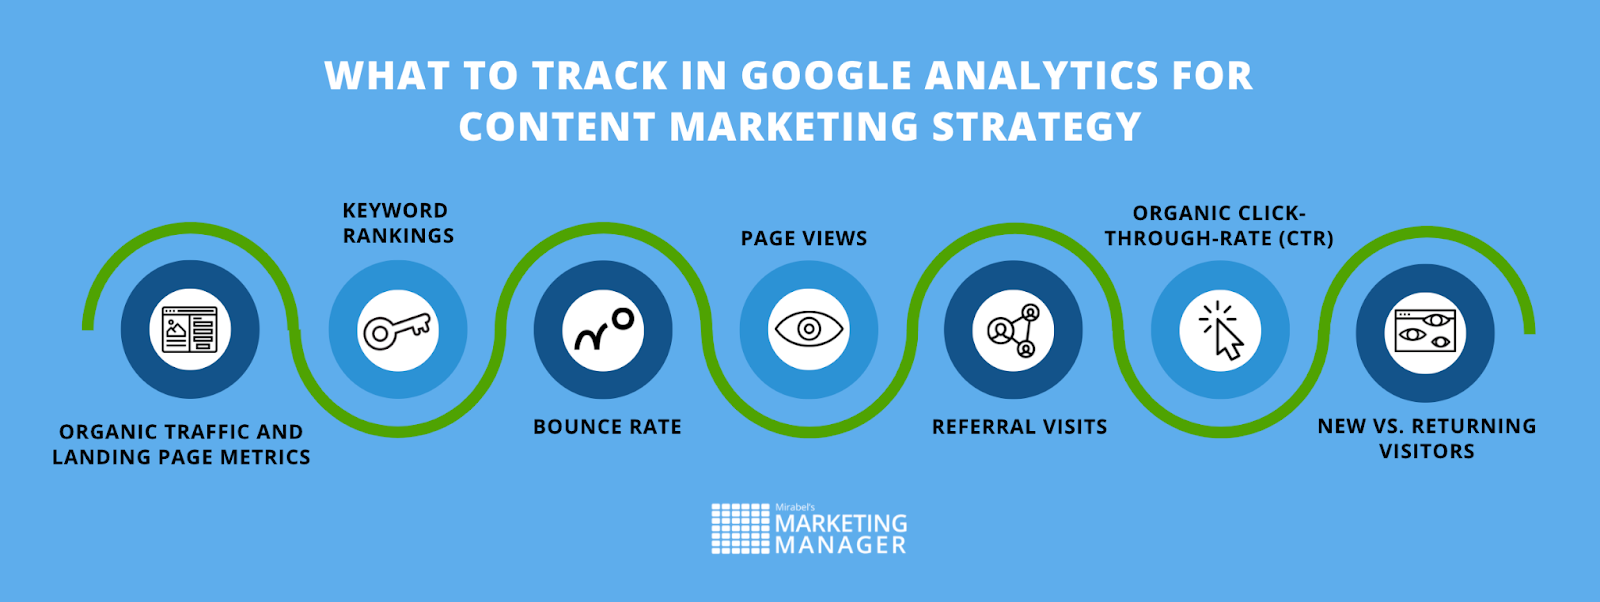
Organic Traffic and Landing Page Metrics
Tracking your website’s organic site sessions over time is one of the most valuable ways to gauge search engine optimization (SEO) success.
After all, keywords are vital to content marketing.
This metric is especially useful, because it helps you understand whether or not your website’s organic traffic (via Google searches) is consistently growing, declining, or stagnating.
While you may often focus on the overall traffic to your site, it’s important to consider the data that lies within separate pages on your site.
To truly understand your content performance, you need to know the details for each landing page. Segmenting the data allows you to gain a better idea of what visitors are clicking on.
Digital Marketing Tip: Segment the data even further by putting time constraints. Content data is most valuable in the last six months. By this time, the average blog should be crawled by Google and display a decent traffic metric.
How do you find this in Google Analytics?
Look for Behavior > Site Content > All Pages. Check out page views, average time spent on pages, exit rate, bounce rate, and page value of each landing page.
Keyword Rankings
As we mentioned before, keywords have a major impact on content.
Keyword ranking determines the bulk of your website’s traffic and lead generation. It also allows you to better understand the effectiveness of your SEO strategy.
Do you need to target more long-tail keywords? Do you need to repurpose content to rank on the first page? Should you add more negative keywords to your Google Ads?
To find this metric, go to Behavior > Site Search > Search Terms. Here, you can gather information on which keywords people are looking for when they find your site.
Once you find the most relevant keywords, you can create new and optimize existing content to include those terms.
Bounce Rate
Bounce rate indicates the number of people who visit your site but leave without clicking on any other links or pages. Essentially, a bounce is a one-hit visit.
This analytic can help you pinpoint pages that visitors may not be interested in. The pages might not have enough back-linking, relevant content, or proper formatting. They may be outdated, work poorly on mobile devices, or are slow to load.
A website’s bounce rate is calculated by dividing the number of single-page sessions by the number of total sessions on your site. Track the bounce rate in Google Analytics by going to Behavior > Site Content > Landing Pages Report.
Page Views
One of the easiest ways to continuously create great content for your target audience is to evaluate top-performing content.
In order to develop this content strategy, you need a deep understanding of what website visitors find valuable. What better way to do that than by looking at Page Views in Google Analytics?
Page Views dissect which content is getting the most attention from your website visitors, whether it’s paid or organic. (You can segment that data in here, too.)
Additionally, Comparison View and Average Time on Page are also great metrics. These complementary analytics show you which content users spent more time on. From there, you can repurpose and update your most successful content.
Referral Visits
People find your content in a variety of ways:
- Direct: Typing a URL into the search bar
- Social Media: Clicking on a call-to-action or link from a social media profile or post
- Email: Clicking on a call-to-action or link from an email
- Organic: Typing a keyword into Google or other search engine and clicking on a high-ranking link
- Paid: Clicking on a link from a promoted post via social media, Google Ads, or other PPC/SEM campaign
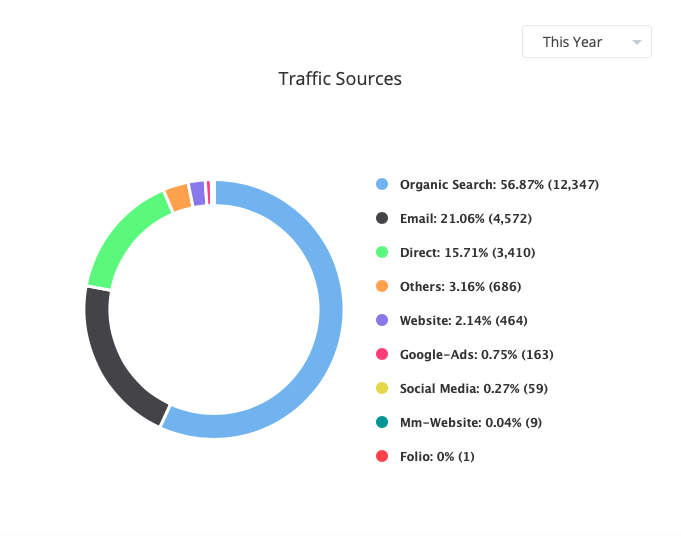
When users come from social media, email, or other websites with backlinks, it’s called referral traffic.
That’s why Google offers the Referral Visits metric: To keep track of how website visitors are getting to your content.
When strategizing new ways to reach your target audience, you need to understand where they’re coming from.
How did they discover your content? What device were they using?
Knowing the answers to questions like these give helpful insight into polishing persona research and optimizing content for that channel.
View the details using the channel grouping feature in Acquisition > All Channels > Traffic.
This digital tool creates custom channels based on your preferences. With channel grouping, you can improve content promotion and strategy by focusing on the most trafficked channels.
Organic Click-Through-Rate (CTR)
Organic CTR determines how your content meets the needs of your audience.
For example, a user finds your link in organic search, but they don’t click.
Or a user clicks on your link but doesn’t click through to other links on your website.
Why did they choose to keep scrolling rather than clicking through your website?
If your content isn’t connecting with your site’s visitors (or well-connected to other relevant content via backlinks), it’s important to adjust. Add more internal links and/or edit links for relevancy to keep users clicking.
To determine your site’s organic click-through rate, click on Search Traffic > Search Analytics. Then, opt to show clicks, impressions, and position. Google Analytics helps by allowing you to download all the data in Excel, making it easy to digest and calculate.
It’s important to note that there’s no singular standard for what a “good” CTR is. It’s typically based on industry, type of content, and paid versus organic. Looking at this metric steadily over time will help you determine if your content marketing strategy is working.

New vs. Returning Visitors
New visitors are defined as website visitors who are visiting your site for the first time on a particular device.
Returning visitors are those who’ve been to your site before and are back for more content.
A new website visitor is great. A returning one is even better.
Why?
A returning website visitor indicates that this user finds your content helpful, relevant, and trustworthy. They’re more likely to recommend your content (or product or service) and be nurturing through the buying process.
Thankfully, Google Analytics offers the New vs. Returning Visitors metric. Comparing the number of new vs. returning visitors is very useful, because it allows you to see the quality of traffic that you attract with your content.
Find out your new vs. returning visitors ratio by going to Audience > Behavior > New vs. Returning.
Understanding this ratio in Google Analytics helps you to determine whether or not your content is valuable in the long term.
Using Google Analytics to Optimize Your Content Strategy
Now more than ever, it’s about data-driven content marketing.
While the sheer volume of data that Google Analytics provides can be intimidating, there’s a lot of insight that can help you achieve real results. By focusing on these content marketing metrics, you’ll be able to gain a better understanding of your site’s traffic, navigation, and content relevancy.
These data points help you fine-tune your content marketing strategy, so you’re able to help your audience and tie revenue directly back to your content.
Kelly Jacobson contributed to this blog.
SEE FOR YOURSELF
Watch an overview to learn how B2B marketing automation by Mirabel Technologies can help you increase traffic, optimize your funnel, drive more leads, improve conversions, and boost ROI — at a price you can afford!
