You Need to Track These Content Marketing Metrics and Here’s Why

Table of Contents
With content marketing continuing to dominate the digital marketing space, measuring its effectiveness is vital for informing future strategies. Nowadays, the number of clicks your blog gets, although important, aren’t the only definitions of its success.
Many companies have pivoted to blogs, video, and even podcasts to drive conversions. Building brand awareness, engaging audiences, generating leads, selling products – these are the ultimate goals of content marketing. Consistently achieving these goals is no easy feat, but a well-informed content marketing strategy can steer you a lot closer to success.
And what do I mean by well-informed? I mean a strategy backed by data. Content marketing can be a money-guzzling endeavor if not executed well, so this is where your analytics come in. In this blog, we’ll discuss the metrics to track for common types of content as they relate to specific marketing goals, what this data reveals, and how you can use your findings to optimize your content marketing strategy.
Tracking the right content metrics for each marketing goal
Every brand’s marketing goals are unique, and these goals should be top of mind when creating content, as this will help you determine which specific metrics to analyze when evaluating a piece of content’s success.
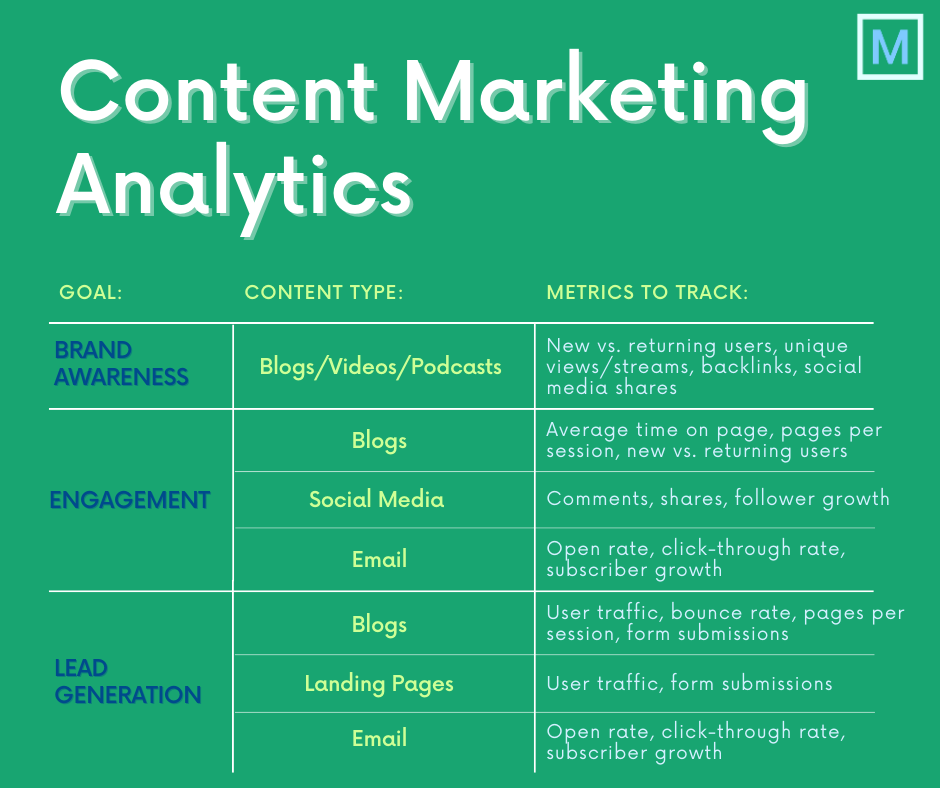
Brand awareness
If your goal is brand awareness, you’ll want to focus on informative, accessible content such as blogs. Videos and podcasts fall into this category as well. Basically, you want to offer helpful information for anyone who wants it in order to garner recognition and build a trusted reputation for your brand. For blogs and similar content types that aim to drive brand awareness, the top metrics to analyze are:
- New vs. returning user traffic
This metric will show you how many people viewed your content and later returned to reference it. Ultimately, you’ll be able to determine whether your content succeeded in being valuable. A low number of returning users indicates your content isn’t quite up to par with what they were searching for, or perhaps not engaging enough to revisit, which indicates that you should make updates and improvements.
- Unique views/streams
This metric will show you how well your content’s really doing in terms of reach.
Here’s a completely hypothetical scenario to better illustrate the importance of tracking unique views: In May 2020, Spotify reported that the “Hamilton” soundtrack had one million total streams. Impressive, right? But, upon a closer look at the breakdown of those one million streams, we’d see that 999,999 of those streams came from one person (me), bringing the number of unique streams to a much less impressive two individuals.
Exaggerated example aside, the number of unique views and streams your content receives matters, maybe even more than the total, because it shows how many individuals are engaging with your content. Low unique views/streams indicate that the methods used to attract users to your content, such as SEO and social media, need improvement. This could mean updating the keywords in your blogs to better match users’ search intents, or creating social media captions and graphics that pique user interest.
- Backlinks
When other websites link to your content, this is a backlink (very meta, I know). You want a high number of these, as this indicates your content is succeeding as an authoritative, informative resource. Low levels of backlinks can mean that your content wasn’t helpful or didn’t provide any new information. Consider adding a unique element, such as data, survey results, or fresh insight, to your blog or video to ensure it stands out among similar content and is worthy of being linked to.
- Social media shares
Similar to backlinks, a high number of social media shares indicates that readers or viewers found your content piece to be valuable and worthy of sharing with connections on platforms like LinkedIn and Facebook.
Engagement
To achieve higher levels of engagement, you’ll want to utilize blogs, social media posts, and email. If you’ve already got an audience reading your blogs, following you on social media, and subscribing to your emails, you’re off to a great start. But, you want your content to engage so audiences keep coming back for more. The metrics for this goal are content-specific.
For blogs, you’ll want to look at:
- Average time on page
The longer, the better! Blog creation is hard work, so you want to make sure people spend time validating that effort. A short average time on page likely means your blog didn’t provide the solution your visitors sought. To fix this, take a look at the search queries leading to your blog. Do they match your blog’s title and content? Or do they just contain a popular keyword featured in your blog?
If I were to search “email marketing design tips,” it’s likely that a blog featuring the keyword “email marketing tips” would appear as a result. After clicking on it, I’d realize the tips provided don’t meet my user, or search, intent, so I’d close the page. You need to make sure your blogs meet the user’s intent, so try updating titles and copy to better incorporate the keywords and keyword phrases being searched that lead to your blog. And, if those keywords don’t really fit the context of your blog, consider writing a new blog that can incorporate those keywords.
- Pages per session
This metric shows you the number of pages on your website a user engaged with after that first interaction. Multiple pages per session indicate that your content sufficiently satisfied a user’s need and he or she was then drawn to peruse your other offerings. A low number of pages per session means you need to reevaluate your content to make sure the solution you’re aiming to provide is clear. It could also mean you need to improve your website’s navigation so accessing other blogs or different parts of the website is easier for users.
- New vs. returning user traffic
We touched on this one earlier, but again, this metric indicates that users found your content to be valuable and are now returning to engage with it.
For social media posts, you’ll want to look at:
- Comments
While likes are nice, they’re the bare minimum form of engagement. Earning a comment means users have found your content valuable enough that they went above and beyond simply “liking” to engage with you. Low comment rates indicate you haven’t engaged your users enough. Try encouraging conversation about the content you’re showcasing by asking a question or including a discussion topic in your social media post’s caption.
- Shares
Again, shares indicate that users found your content to be valuable and think their network of connections could benefit from reading your content as well. Typically, if your like and comment rates are high, the number of shares should be high as well.
- Follower growth
Similar to the new vs. returning user traffic metric for blogs, follower growth for social media indicates that users have found your social posts valuable and want to see them regularly. A stagnant or decreasing follower number indicates that your content isn’t consistent or providing the solutions potential followers want. Take a look at your posts that have performed well and mimic them for future posts.
Email engagement can be tracked by:
- Open rate
After deploying an email campaign, the first thing you should look at is your open rate. Average open rate benchmarks vary per industry, but if you’re not averaging a rate around 20-25%, something’s wrong. There could be a few factors behind this, including a poor sender reputation (meaning your campaigns aren’t even being delivered), too broad of an audience (meaning it’s time to start segmenting), an unengaged audience (meaning it’s time to scrub and re-engage), a questionable sender name (meaning it should be clear who your campaigns are coming from; no tricky business here), or an underwhelming subject line (meaning A/B testing should be your number one priority for future campaigns).
- Click-through rate
Like open rates, the benchmarks for click-through rates vary per industry, but if yours falls between 2-5%, you’re in a good spot. If not, consider the same factors that could be behind a low open rate, but add to that body content (which likely needs to be more engaging) and links or call-to-action buttons (which likely need to be more effective.)
- Subscriber growth and loss
Like the follower growth metric for social media, this metric indicates that your content has appealed enough to users that they want to engage with it regularly. A stagnant number of subscribers, or an increased unsubscribe rate, means your email content isn’t fulfilling the needs of your audience.
Lead generation
When it comes to lead generation, blogs, lead capture forms (via landing pages), and email are the best content types to use because they work together to attract, engage, and nurture leads.
For blogs, the metrics you’ll want to look at in the context of lead generation are:
- Traffic
You need to know what blogs are driving the most visitors to your website, and where that traffic comes from. Organic search? Direct traffic? Referrals? Social media? If a blog on a certain topic receives significantly more organic search traffic than your other blogs, it’s safe to assume that topic is a popular one, and writing more blogs on it could lead to more traffic.
- Bounce Rate
A bounce rate shows you the percentage of visitors who left your website immediately after landing on a specific page. Now, thousands of clicks on a blog is great, but if your bounce rate is high, you’re not getting conversions, and you’ve got a problem.
- Pages per session
If you’ve sprinkled call-to-action (CTA) buttons throughout your blog like a good content marketer, this metric will show you how well those CTAs are performing. If you’re using Google Analytics, you can use the Behavior Flow tool to get a visual of users’ starting pages and subsequent interactions with your site.
- Form submissions
You should be using your blog to prompt readers to subscribe to your blog newsletter or marketing emails. If a blog with high traffic isn’t generating many blog subscriptions, it’s possible your user intent game isn’t up to par and readers can’t find the information they seek in your content.
Lead capture forms (via landing pages):
- User traffic
Since a landing page is typically just a piece of a larger campaign, monitoring user traffic will show you how many users were captivated enough by your initial outreach effort (email, social media post, or paid search) to click through. If the audience you’re targeting, such as an email list, social following, or searchers of a popular keyword, is relatively large but your landing page’s user traffic is minimal, you’ll want to focus your optimization efforts on the offer and CTA featured on the initial outreach to ensure they generate more user traffic next time.
- Form submissions
Whether you’re offering a free trial, discount code, product demo, or gated content, the sole goal of your landing page is a form submission. This metric will help you understand whether your offer is enticing enough to visitors. A low rate of submissions could mean you need to modify your form (you could be asking for too much information) or your offer.
Email:
In the context of lead generation, email works a little differently. Your content must deliver on the offer promised in exchange for the form submission, and subsequent emails need to nurture that relationship. Workflows are a fantastic tool to automate this process, but you need to make sure you’re monitoring each email’s
- Open rate
This number should be high, as subscribers have specifically opted-in to receive the content your email contains. A low open rate could be due to the amount of time between the form submission and receipt of the email. The larger the window of time, the more likely it is for a user to lose interest or possibly even forget he or she signed up for your content in the first place. Adjust your workflow to deploy that initial email as soon as a form submission is complete to ensure optimal open rates.
- Click-through rate
Again, this number should be high. Individuals have converted to subscribers specifically to get their hands on whatever lies behind your “Download Now” CTA. Low click-through rates can be attributed to the amount of time between the form submission and receipt of email, like low open rates, but it could also be that underwhelming body copy or CTAs within the email have left your subscribers uninterested in your content. For the copy, don’t get too lengthy. Pitch your content in a way that’s appealing but not gimmick-y. For the CTA, don’t be afraid to A/B test different phrases, fonts, colors, and sizes. It takes time, but you’ll eventually find one that works, and that’s better than settling for one that doesn’t.
- Subscriber growth
This metric indicates that your content offer is appealing enough for users to willingly hand over their email addresses and other personal information in exchange for your content. If you aren’t seeing much subscriber growth, it’s possible that your offer isn’t as exciting as you hoped it would be, or at least you’re not presenting it as well as you could be. Poor form layout (i.e. not user-friendly or asks for too much information) and a lackluster CTA could also dissuade subscriber growth.
Conclusion
So, there you have it. Analytics can provide a wealth of information when it comes to breaking down your content marketing performance. They can help you determine what’s working, what’s not, and in the case of the latter, where to improve. Whether your content marketing goal is brand awareness, engagement, lead generation, or a combination of all three, knowing which specific metrics to track will help you fine-tune your strategy and achieve those goals without wasting valuable time and dollars.
SEE FOR YOURSELF
Watch an overview to learn how B2B marketing automation by Mirabel Technologies can help you increase traffic, optimize your funnel, drive more leads, improve conversions, and boost ROI — at a price you can afford!

